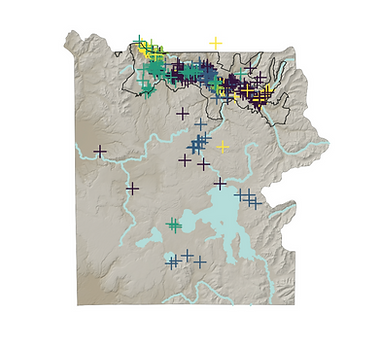
This tutorial walks through the steps of making informative and visually striking maps in R. From the most basic building blocks, we add detail using well-developed R packages. The resulting map displays the locations of your study sites or sample collections. In an effort to make these tutorials more interactive, my GitHub page includes both a code pipeline and some example data that can be fed directly into the code.